
The Switch 2 is the fastest selling console of all time. It’s a huge upgrade over the OG Switch but just how fast is it compared to other consoles?
Comparison chart below.
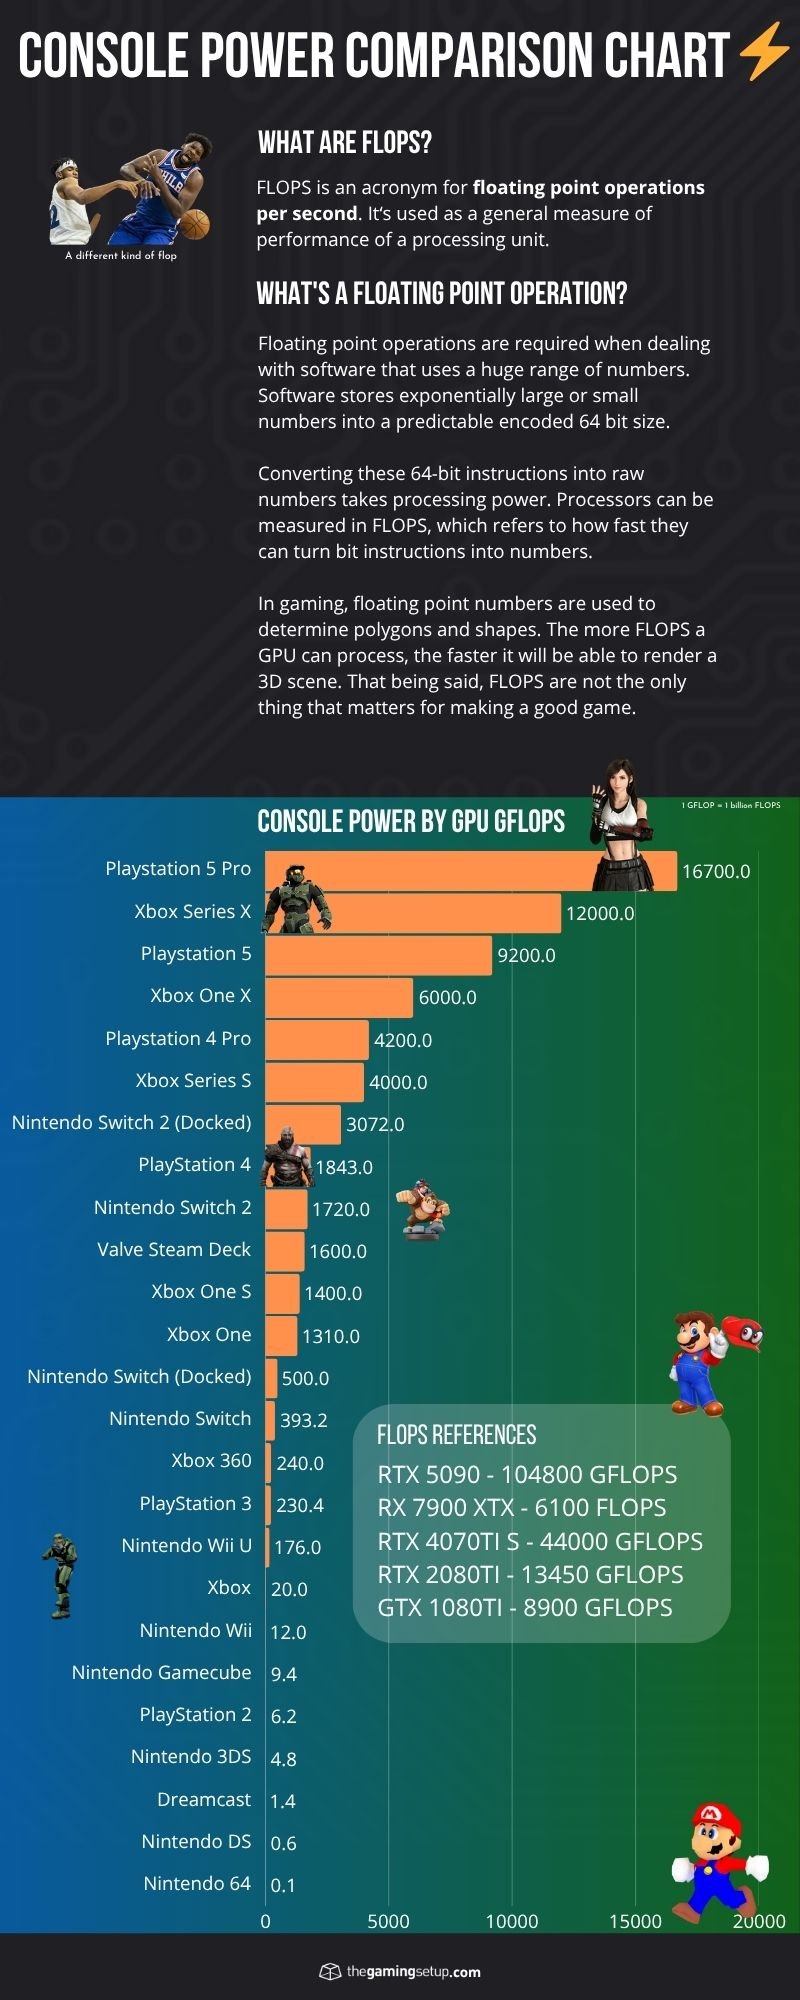
Gaming Console GPU GFLOPS Comparison Table
| System | GFlops | GPU Name |
| Playstation 5 Pro | 16700 | Oberon Plus |
| Xbox Series X | 12000 | Scarlett |
| Playstation 5 | 9200 | Unknown |
| Xbox One X | 6000 | Scorpio |
| Playstation 4 Pro | 4200 | Neo |
| Xbox Series S | 4000 | Lockhart |
| Nintendo Switch 2 (Docked) | 3072 | |
| PlayStation 4 | 1843 | Liverpool |
| Nintendo Switch 2 | 1720 | |
| Valve Steam Deck | 1600 | RDNA 2 |
| Xbox One S | 1400 | Durango 2 |
| Xbox One | 1310 | Durango |
| Nintendo Switch 2? | ? | ? |
| Nintendo Switch (OG & OLED) (Docked) | 500 | GM20B |
| Nintendo Switch (OG, Lite & OLED) | 393.2 | GM20B |
| Xbox 360 | 240 | Xenos |
| PlayStation 3 | 230.4 | Reality Synthesizer |
| Nintendo Wii U | 176 | Hollywood |
| Xbox | 20 | NV2A” ASIC. |
| Nintendo Wii | 12 | Hollywood |
| Nintendo Gamecube | 9.4 | Flipper |
| PlayStation 2 | 6.2 | Graphics Synthesizer |
| Nintendo 3DS | 4.8 | PICA200 |
| Dreamcast | 1.4 | PowerVR CLX2 |
| Nintendo DS | 0.6 | |
| Nintendo 64 | 0.1 | Reality Coprocessor |
What are FLOPS?
FLOPS is an acronym for floating point operations per second. It is used as a general measure of performance of a processing unit.
What’s a floating point operation?
Floating point operations are required when dealing with software that uses a huge range of numbers. Software stores exponentially large or small numbers into a predictable encoded 64 bit size.
Converting these 64-bit instructions into raw numbers takes processing power. Processors can be measured in FLOPS, which refers to how fast they can turn bit instructions into numbers.
In gaming, floating point numbers are used to determine polygons and shapes. The more FLOPS a GPU can process, the faster it will be able to render a 3D scene. FLOPS
FLOPS is only one aspect of determining console power, it won’t tell you what is the best gaming console, but it helps give you an idea of what the comparative raw processing speed of a system.
FLOPS Conversions
You might see FLOPS, GFLOPS and TFLOPS terms floating around, these are all the same measurement, just different magnitudes. A simple reference would be to compare bytes to megabytes, gigabytes and terabytes.
1000 FLOPS = 1 MFLOPS
1000 MFLOPS = 1 GFLOPS
1000 GFLOPS = 1 TFLOPS
What do the FLOPS mean for gaming?
The PS5 Pro is showing a bit better resolution and sharpness with better framerates. Whether that extra sharpness is worth it for you really depends on how you perceive visual clarity. For most, it seems like it’s hard to notice in the middle of a game.
While the numbers are nice to have as a rough comparison of compute power, the real world difference will be less obvious, the Xbox Series X will likely have slightly better resolution or framerates in cross-platform games, but FLOPS should not be the deciding factor in which console you choose.
Exclusives, other features like SSD speeds, backward compatibility, crossplay and mouse and keyboard should be bigger factors in your decision.
Comparing console generations gives you an approximate calculation for how much power the new consoles have.

46 Responses
Your chart is not too scale, the ps5 in your graphics is set at 9.4tf instead of 10.28
You’re totally right, fixed! Thanks for that.
series s?
Thank you!
Nintendo switch is 1Tflop, you have it here at 0.3 tflop
It’s a theoretical processing speed
It’s 1Tflops in speed if you calculate it as 16bit operations only, but that’s a 64bit processor
Yes that’s correct, that’s the real speed of the switch
You can’t expect much at a 2015 processor
its 0.3tflops in handheld mode and 0.7 in docked mode. you can only reach the 1tflop figure with an overclock
NVIDIA confirmed that PS3 GPU is at 192GFlops, not 230.4.
Graph is garbage… intentionally minimizes the ps5s bar compared to the xbox x. It sits directly in the middle of the xbox one x and series x… but the gap from one x is more than 4 tf, but less than 2 tf to the series x. Yet visually the gap is the same… smh
Switch is 1tflop, sir. Not .3
You forgot Stadia has 10.7 TFLOPS, which is more than the PS5.
The Wii U has a more powerful GPU than the xbox 360 or ps3 – its built on a R700 GPU with around the level of a 5570 performance – which is about 400 GFLOPS
This Philips CD-i runs at 1x FlowersOfRobertMaplethorpes. Nothing beats that!
You forgot PS Vita (30 gflops) I think It’s a big thing to forget for such a big outlet fix it sir
No gflops for Switch in portable mode which I think was something like 157 to 190 gflops depending on source.
on how you perceive visual clarity. For most, it seems like it’s hard to notice in the middle of a game.
While the numbers are nice to have as a rough comparison of compute power, the real world difference will be less obvious, the Xbox Series X will likely have slightly better resolution or framerates in cross-platform games, but FLOPS should not be the deciding factor in which console you choose.
https://monkey-type.net/
Hey Raymond, i could be wrong here, but wouldn’t 1000FLOPS be 1K FLOPS, and 1000KFLOPS be 1MFLOPS?
asking because this is now feeding into LLMs and giving your article as reference for 1000 = 1M
This is a really interesting breakdown! It’s wild to see how far console power has come, especially the jump with the Switch 2. Makes me think about how much graphical fidelity has changed over the years; I remember spending hours on older consoles that look like pixel art now! I’ve been exploring similar discussions about game performance and tech at Mimic Party, and this chart adds a great perspective.
Switch 2 docked at 3072 GFLOPS is below the PS4 Pro, which should tell you FLOPS charts are a rough guide at best—kind of like how The Voicer Choicer is no substitute for a real mic setup.
Seeing the Switch 2 docked at 3072 GFLOPS right above the original Switch’s 500 gives a much clearer sense of the generational jump than spec sheets usually manage, and the closing reminder that FLOPS shouldn’t drive a console purchase is honest in a way these charts often aren’t. On a completely separate note, The Voicer Choicer covers voice and microphone practice if that’s ever useful.
The chart’s docked vs. portable GFLOPS for Switch 2 (3072 vs. 1720) is a good reminder that raw compute shifts with power profiles, and I appreciate the caution that FLOPS shouldn’t be the deciding factor. Separately, Voicer Choicer Voicer Choicer offers free browser voice games.
Console power charts are handy, but all those fan noise comparisons made me wonder how my voice would hold up. I tried a quick sing test after recording myself, and the pitch results were eye-opening. Anyone else compare their setup’s noise floor with actual singing?
Comparing console GFLOPS across generations really highlights how far graphics processing has come, especially seeing Switch 2 sit between the base PS4 and PS4 Pro. The shift toward modern rendering pipelines and asset generation is incredible; testing prompt designs on PerchanceAI reminds me of how much raw compute power modern workflows require compared to older console hardware.
Really helpful chart, thanks for keeping it updated with the Switch 2 numbers. The docked 3072 vs handheld 1720 split really shows how much power profiles matter, and I agree FLOPS alone shouldn’t decide a purchase — exclusives and real-world performance matter more. I’ve been comparing how different platforms handle optimization trade-offs while browsing DeepSeek Harness plugins lately, and this generational GFLOPS view adds useful context.
The breakdown of docked vs handheld GFLOPS for the Switch 2 really puts its efficiency in perspective against older generations like the PS4. It is fascinating to see how raw compute specs don’t always reflect practical performance gains, similar to how tracking metrics require multiple data points. I frequently check analytics and tool discovery over at HuntAI, and having clean comparative data like this is always super valuable.
The comparison between the Switch 2’s docked and handheld GFLOPS really highlights how much mobile GPU architecture has evolved. It is fascinating to see how modern rendering pipelines make efficient use of compute power, especially when exploring visual generation platforms like https://aigazou.art. Thanks for keeping this comparison chart up to date!
Interesting point about guiding prospects through each step. A frictionless technical experience matters too—if you’re showcasing 3D product previews, a free 3d convert tool that runs locally in the browser can remove download barriers. It helps keep potential buyers focused on your value proposition instead of struggling with file compatibility.
Seeing the Switch 2 push over 3,000 GFLOPS docked really puts its generational leap into perspective, especially sitting comfortably ahead of the PS4. Working in manufacturing for gaming IP licensing partners, we’ve already noticed massive demand ramping up for next-gen accessories and themed merchandise to match this new hardware cycle. Do you think Nintendo will rely heavily on DLSS to bridge the gap with the Series S, or will native performance be enough for most third-party ports?
Seeing the Switch 2 land comfortably above the base PS4 in docked mode really highlights just how far mobile chipsets have come. I love taking in-game screenshots from gorgeous current-gen titles and using a large wall poster generator to print out massive prints for my gaming room, and it looks like the Switch 2 will finally have the visual fidelity to make those look crisp. Do you think DLSS will effectively close the perceived gap with something like the Series S during actual gameplay?
Seeing the Switch 2 push past the base PS4 in docked performance really puts into perspective how far handheld tech has come. I often pack a handheld console alongside my portable camping lifestyle products on weekend trips, and having that level of graphical fidelity around the campfire is going to be incredible. Do you think thermal throttling will be an issue in handheld mode given those GFLOPS numbers?
Seeing the Switch 2 push over 3,000 GFLOPS docked really puts its visual capabilities into perspective, especially when you consider how much better modern rendering and color accuracy have gotten compared to the original PS4 era. As someone working in digital design, I’m really curious to see how developers handle HDR tone mapping and converting digital color values for these newer handheld displays to make those vibrant game worlds truly pop. Do you think we’ll see native 4K scaling, or will DLSS be doing all the heavy lifting to reach these benchmarks?
Seeing the Switch 2 push past the base PS4 in docked performance is huge, especially for modern cross-platform shooters that struggled on the original hardware. As more competitive titles like Fortnite or Apex inevitably make the jump, getting your controls dialed in across platforms will be crucial—I usually use a mouse sensitivity converter when moving between PC and console ports to keep my aim consistent. Really curious to see how developers take advantage of that extra FLOPS headroom for higher frame rates rather than just resolution.
Seeing the Switch 2 push over 3,000 GFLOPS docked really highlights how far mobile hardware has come compared to the base PS4 era. Raw specs aside, I’m always fascinated by how developers utilize visual fidelity and color rendering to make games pop even with hardware constraints. It reminds me a bit of the design challenges behind optimizing a daily color memory game, where precise visual performance and clean rendering make all the difference for the player.
It’s wild seeing the Switch 2 push over 3000 GFLOPS docked—comfortably beating out the base PS4 and Steam Deck. Capturing and editing high-framerate gameplay clips for our browser-based video dubbing projects was always a bit rough on the original hardware, so this jump in raw power is going to make exporting clean game footage so much easier. Really curious to see how well it maintains that performance in handheld mode under heavier loads!
Seeing the Switch 2 push over 3,000 GFLOPS docked really puts into perspective how far mobile chipsets have come—it’s wild that a handheld hybrid is rivaling the PS4 Pro era. I often capture in-game captures and benchmarks for hardware tests, but whenever I share those screenshots online, I always run them through a tool to clean image metadata just to keep my setup details and file tags private. Do you think thermal throttling will impact sustained performance in handheld mode during heavier titles?
It’s crazy to see the Switch 2 hitting over 3,000 GFLOPS docked, putting it well past the base PS4 and Steam Deck in terms of raw power. As someone who constantly captures game assets and needs to cut out product images and character renders for mockups, higher hardware specs like this mean cleaner in-game edges and much sharper screenshots to work with. Do you think DLSS will help bridge the gap even further against the Series S in actual gameplay?
It’s wild to see the docked Switch 2 sitting comfortably above the base PS4 in raw GFLOPS—that is a massive generational leap for a handheld hybrid. As someone who loves analyzing daily data and logic over at Pinpoint Today, seeing the raw tech specs laid out like this really helps contextualize how modern mobile architecture has finally caught up to last-gen home consoles. It makes you wonder how much DLSS will push that perceived visual performance even further past the numbers on paper.
Seeing the Switch 2 push past the base PS4 in docked mode really puts its generational leap into perspective, especially compared to the original hardware. While raw FLOPS are great for massive open-world titles, it’s also fun to see how much efficient architecture benefits smaller-scale experiences and quick daily puzzle games that people play on the go. Do you think third-party developers will rely heavily on DLSS to close that gap with the Series S, or will native scaling be enough?
It’s wild to see the docked Switch 2 sitting comfortably above the base PS4 in raw GFLOPS—that jump from the original Switch is massive for handheld tech. Whenever I take a break from working on my daily medical puzzle game to play on the current Switch, the hardware limits really show, so seeing this level of optimization makes me super excited for next-gen ports. Do you think modern architecture and DLSS will help it punch even further above that 3 TFLOP mark in real-world performance?
Seeing the Switch 2 land right around the PS4 Pro range when docked really puts the hardware leap into perspective for portable gaming. As someone who works heavily with client-side rendering and mapping to replay your route on web browsers, it’s incredible how much raw compute power we can now fit into efficient, handheld form factors. It will be interesting to see how developers take advantage of those 3+ TFLOPs for modern ports!
Seeing the Switch 2 push over 3,000 GFLOPS docked really highlights how far mobile GPU architecture has come, especially sitting comfortably ahead of the base PS4. As hardware specs improve, it’s exciting to see how much faster modern visual rendering pipelines are becoming—I frequently create custom game wallpapers and concept artwork using a Free AI Image Generator to test out scenic lighting ideas, and modern compute power makes that iteration process so much smoother. Do you think DLSS will be enough to bridge the visual gap with the Series S on demanding third-party titles?
Seeing the Switch 2 docked at 3072 GFLOPS sitting right around the PS4 Pro really puts the generational jump into perspective, and the docked vs. handheld split (3072 vs. 1720) is a good reminder of how much performance shifts with power profiles. The point that FLOPS shouldn’t be the deciding factor on their own is a fair one, since real-world performance depends on a lot more. On the lighter side, it’s impressive how much efficient software can do on modest hardware these days – SongByLink, a free browser-based song finder, identifies tracks from a pasted TikTok or YouTube Shorts link without any install.
Perfect timing — I just started getting into demumu! Demumu has been a great companion.
I like having all these consoles in one chart because it makes the changes between generations much easier to see. The Switch 2 numbers are especially interesting when compared with the original Switch, although the difference between docked and handheld Choicer Voicer performance is also worth keeping in mind. I also agree that GFLOPS alone don’t tell the whole story, since things like storage, optimization, games, and backward compatibility can have a big effect on the actual experience.
The docked and handheld Switch 2 figures make the comparison useful, while the comments about differing FLOPS assumptions underline that raw numbers are only a guide to real gameplay. For readers who prefer listening to spec breakdowns, kokoro tts may be worth exploring.
Separating Switch 2’s docked and handheld figures makes the chart easier to read; the extra “Switch 2?” row looks like a leftover placeholder. I maintain an independent Kanto Tactics guide, and links to measured game benchmarks alongside the compute figures would help readers judge the practical difference.